
Filtering Infographic Templates Easily:
Improving choice process for Easel.ly customers
Client
Easel.ly Design
Role
UX Research Lead
Project Manager
Duration
2.5 weeks
Problem
Users have difficulty picking an infographic template that fits their business needs from Easel.ly’s 6M+ catalogue of templates. Our client wanted us to conduct research to come up with design solutions to this user problem and evaluate them.
BACKGROUND
Easelly is a design tool company in Gig Harbor, WA with custom and animated infographic services. They were founded in 2015 by their CEO, Vernon Southward. Mr. Southward owns the overall vision of the company to make sure that all of the business functions align as well as product development (planning, customer research, scheduling) and customer support.
The company aims to help people with creating infographics to turn data and written text into easier to digest and attractive visuals. Their users seem to be educators, students, business owners, and executives who want to convey a thought, lesson plan, or concept visually.
MY ROLE IN THIS PROJECT
As the UX research lead, I was responsible for conducting organizational research, planning and conducting user interviews, usability studies, and analyzing the data. I collaborated with the IA lead to create personas, and design card sort studies. I additionally conducted quantitative analyses on the collected data and provided feedback to my teammates throughout the whole project.
As the project manager I managed the communications between my team and the client, and made sure that project milestones were met in a timely manner.

UX RESEARCH PROCESS
Our client approached us with a wizard tool idea and asked us to evaluate the effectiveness of this tool in solving the choice paralysis problem his users have been experiencing. To do this our design lead, Patrick, started building a hi-fi prototype so that I could conduct usability tests.
On a second branch of research, our IA lead, Nathan, and I wanted to test an alternative solution that focused on the information architecture of our client’s website. To do this we conducted two closed card sort tasks to test whether the current website matched users’ mental models of infographic categories.
Due to our limited time frame, I built in user interviews into my usability tests to get to know our clients’ potential users while also getting feedback on the current website and our prototype. The data I gathered during the interviews helped us improve upon our proto-persona and get to know our clients’ users of interest better.
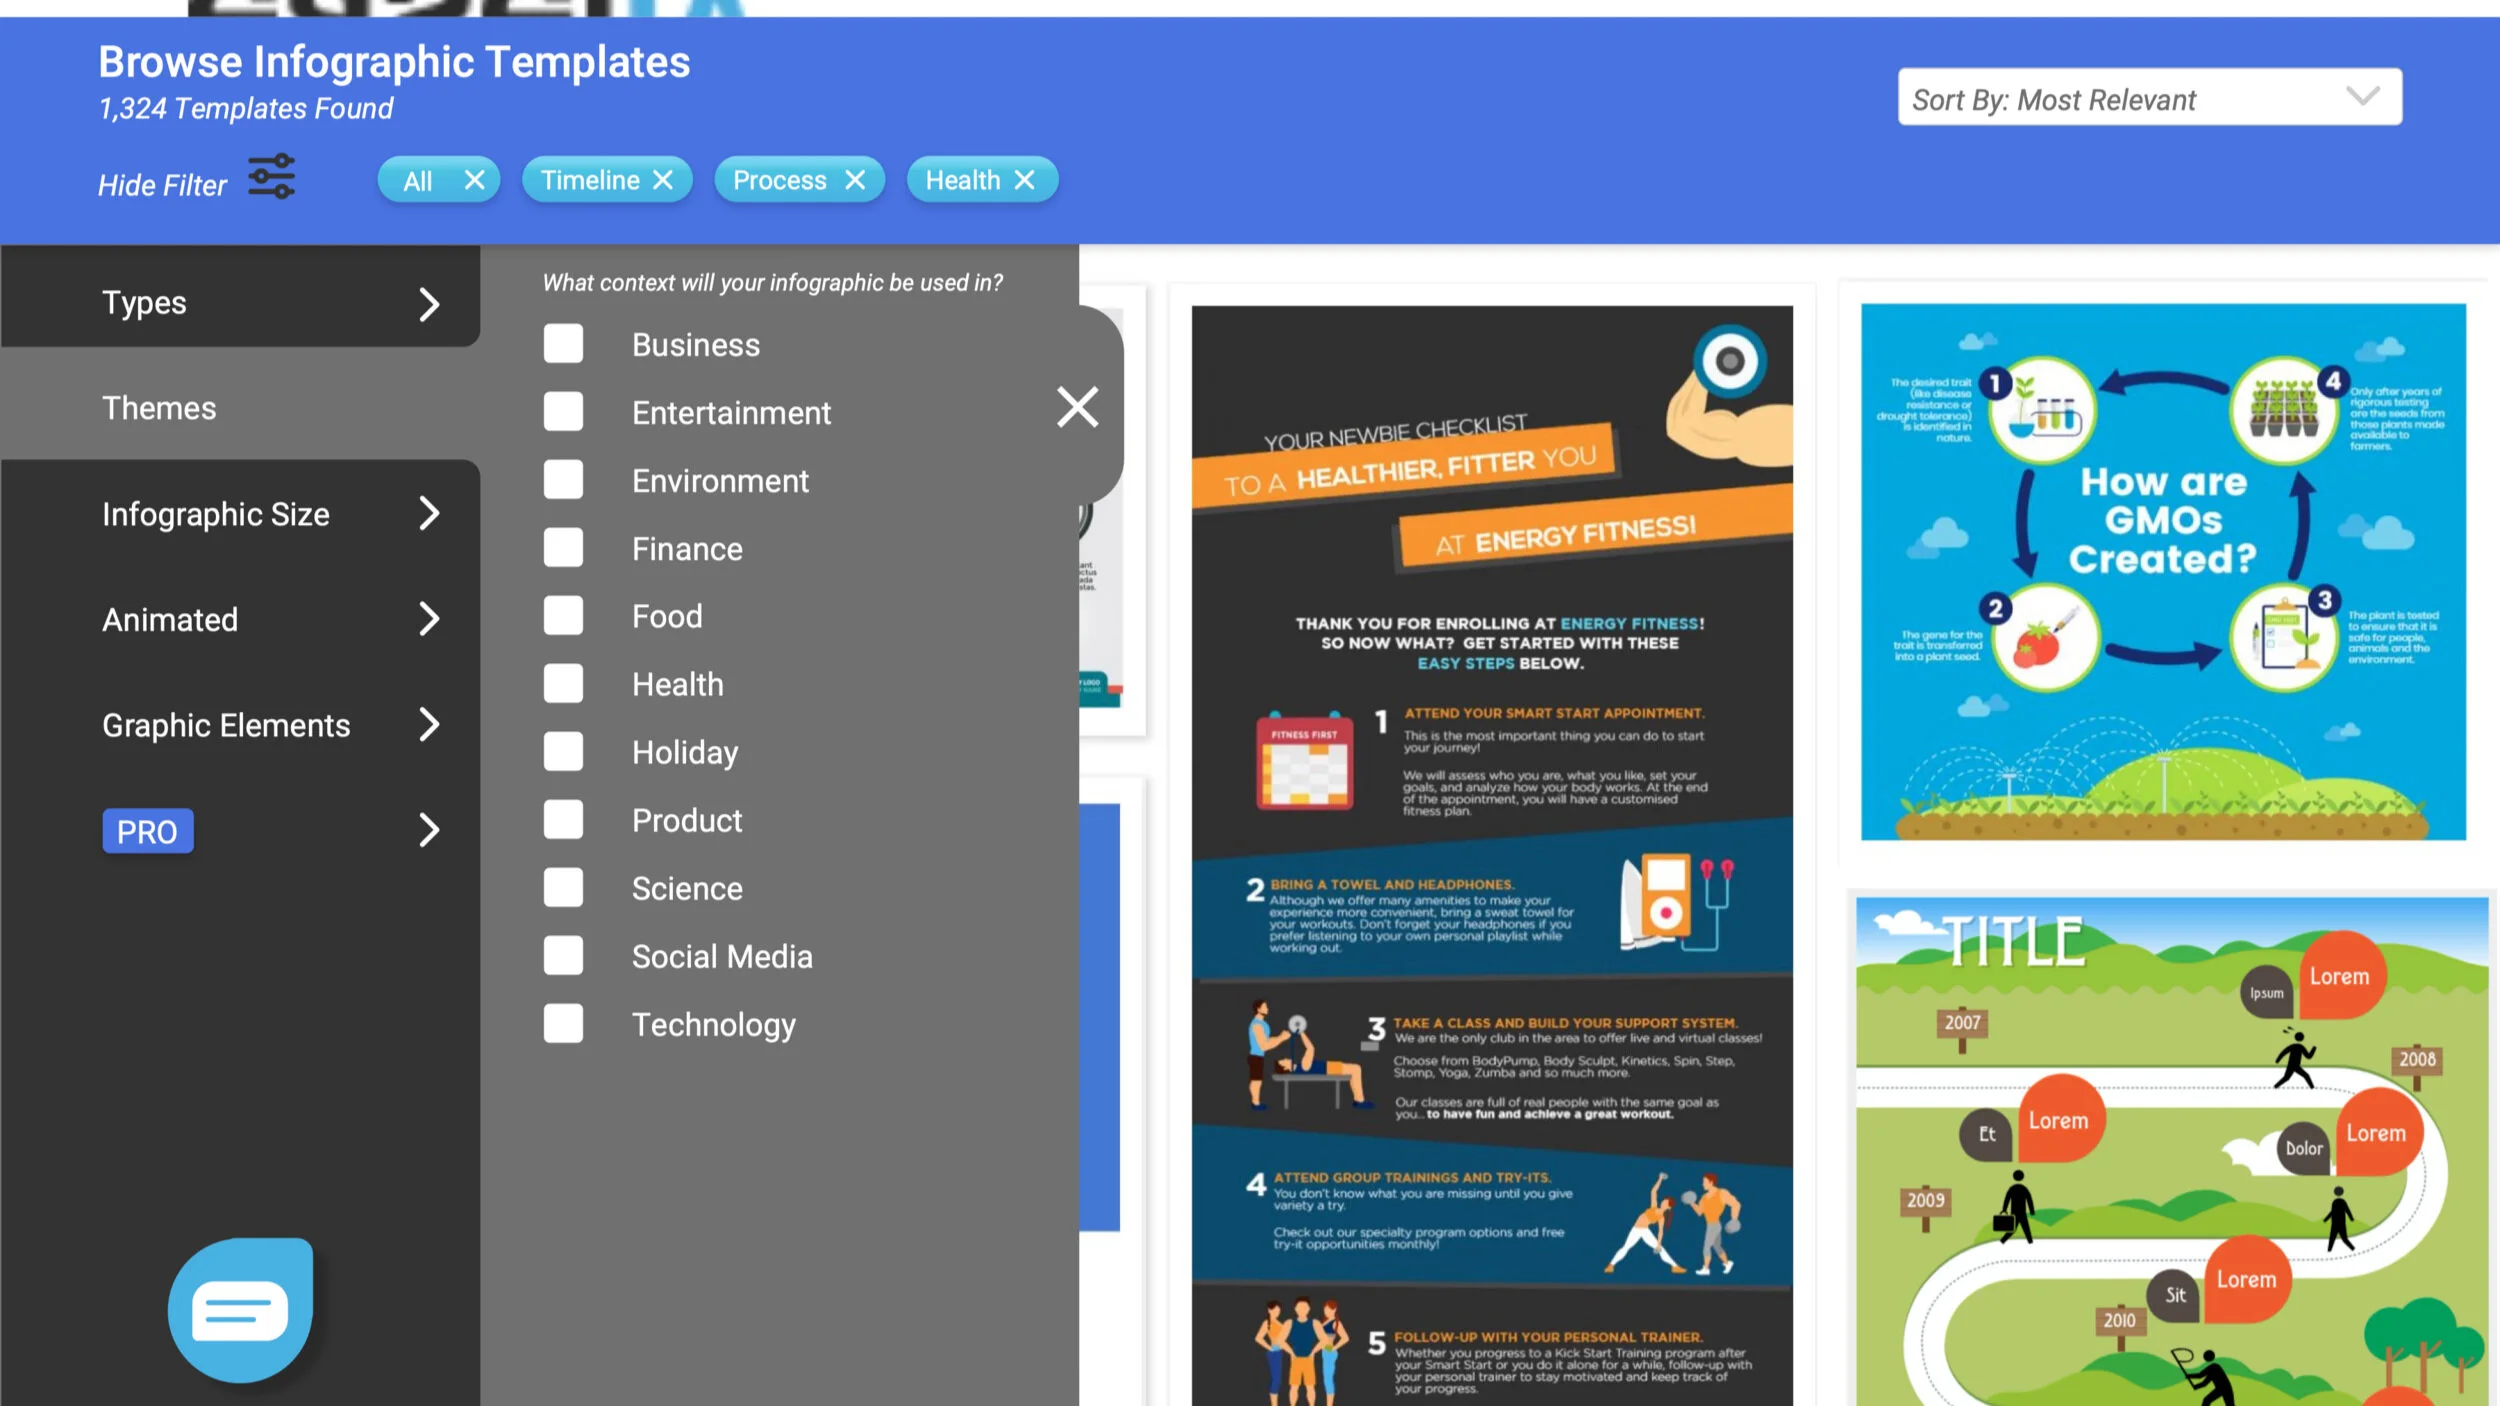
This information, combined with the data we gathered from our usability testing and cart sort tasks informed our design choices for the ver 2.0 prototype, which was a filtering feature.
Conducting further usability tests on this new prototype helped Patrick refine his designs even further. Specifically, users were still experiencing cognitive overload while browsing through filtered templates, which added to their feelings of choice paralysis. Based on this feedback, we came up with two solutions that we could implement, while also solving some accessibility issues that came up during the usability tests.
PROJECT CHALLENGES
Our client wanted us to reach out to potential small business users of his product as conversion was one of the metrics he cared about, so we had to recruit participants through snowballing rather than via Easel.ly’s customer base.
Given the wide definition of “small business” we wanted to recruit as many users with different backgrounds and skill levels as possible, which proved to be difficult but we were able to interview 12 users with varying professions and infographic skill levels.
Because our client had a hypothesis he wanted us to test, I had to come up with a way to adjust to our clients’ needs while also staying true to the UX design and research processes.

The current website performance got a D (poor), while the wizard tool and filtering features received B (good) and A (excellent) grades.
USABILITY STUDIES
We tested 12 users in total, where they tested current website (3 users), wizard tool prototype (5 users), and filtering prototype (4 users).
Both prototypes received higher average SUS scores than the existing website with the filtering prototype receiving the highest score.
Since conversion was also of importance to our client, I performed further analysis on the SUS scores, showing that users were more likely to use the product frequently in either prototype version compared to the existing website. See below for a graph depicting the results.

I would recommend this website to the owner of the medical website I did designs for even though he doesn’t have any experience in design.
— MY, filtering prototype tester
IMPACT
Our client was pleased with our work, and said that our final solution was easier to implement than his wizard tool idea, thus saving him various resources.
Our filtering feature is scheduled to be implemented on the new Easelly website in the first half of 2021.
Despite being out of scope, our initial accessibility findings gave our client a head start in solving these issues for his users as he works on the redesign of his website.